We measure our work by what the systems we build make possible — the actions communities take to protect lives, preserve livelihoods, safeguard assets, and avoid damage and loss. Our evidence of impact comes from traceable anticipatory actions and consistently measured resilience outcomes.
12M
+
Lives impacted via DARAJA, from climate stressed cities to active conflict zones.
93
%
Community access to early warnings achieved - up from 63%.
97
%
People who received a warning took protective action.
5
Global awards for innovation and evidence of impact.
12:1
Benefit-cost ratio (BCR): $12 in avoided losses and generated benefits per $1 invested.
From forecast to frontline action
Our work focuses on closing the gap between climate information and real-world decision making.
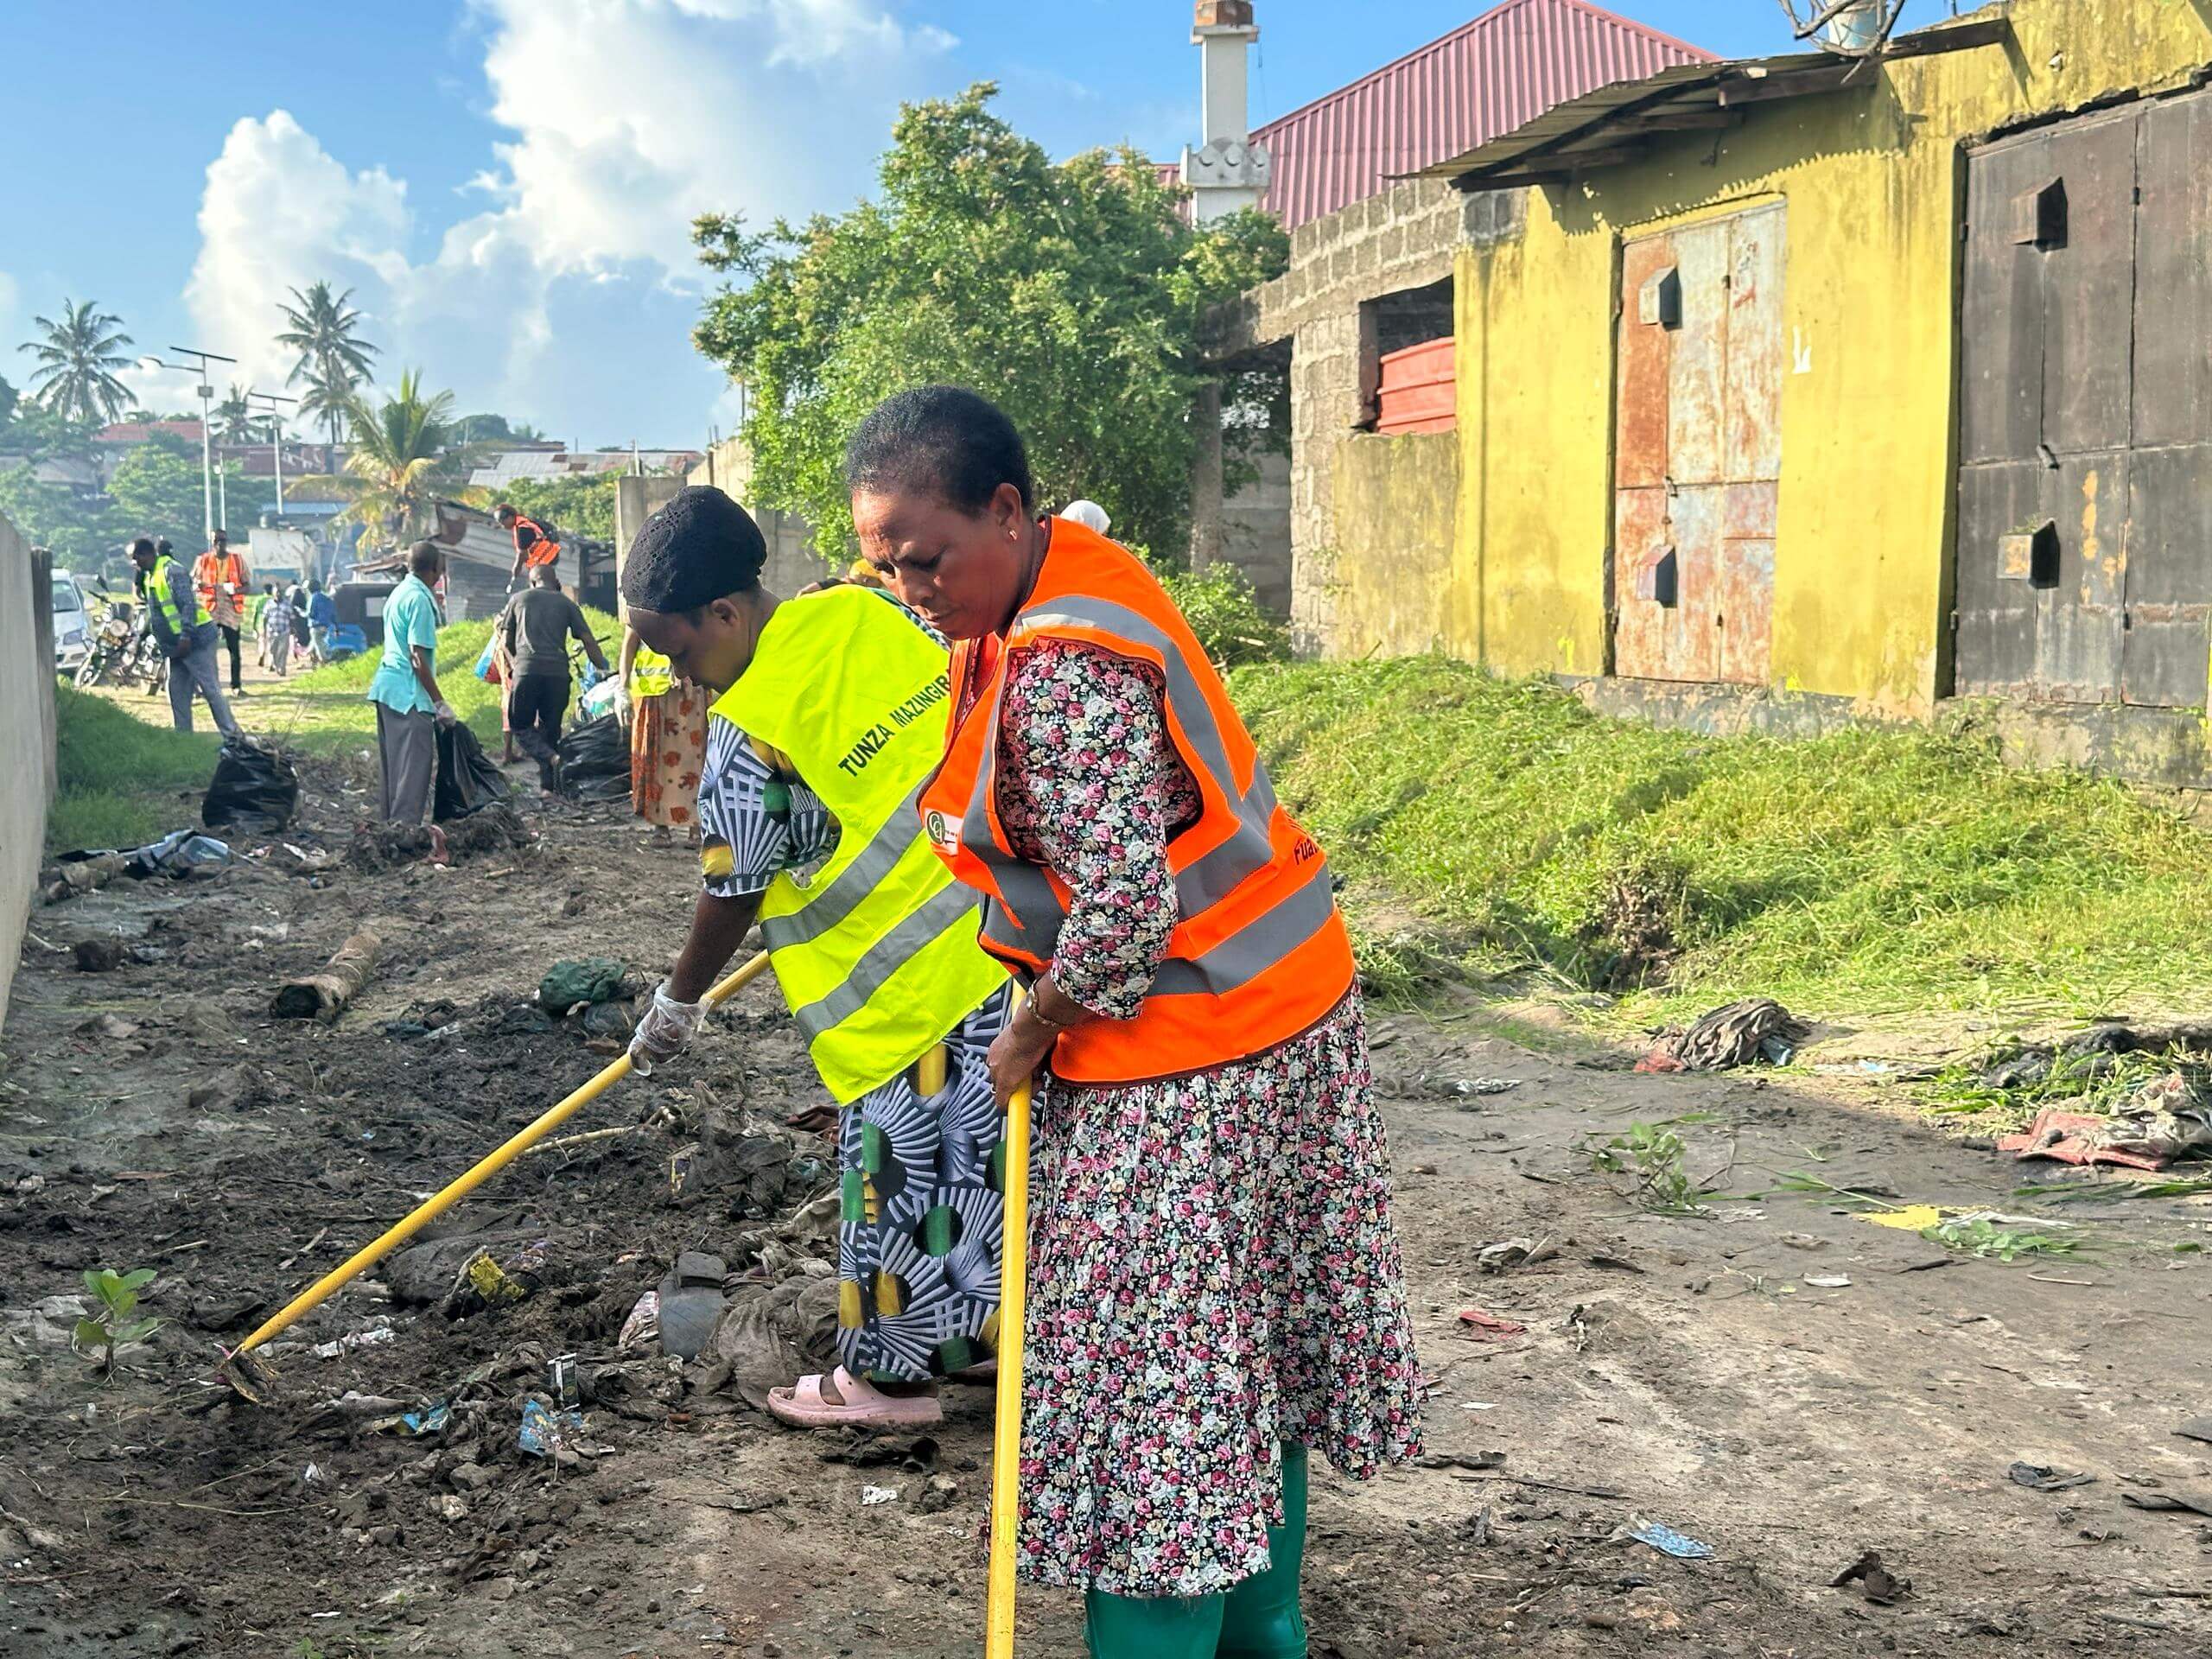
In Nairobi and Dar es Salaam, improved access to weather and climate information has led to clear behavioural change. Residents are taking preventative steps ahead of high-impact weather, including repairing homes, moving possessions to safety, and clearing drainage systems to reduce flooding risk.
These actions translate directly into avoided loss and more stable livelihoods. The result is not just better awareness, but tangible resilience at household and community level.

How we measure impact
We use a combination of quantitative data and community insight to understand what is working and where systems can improve.
This approach ensures our work is shaped by evidence, continuously improved through feedback, and grounded in how communities actually access and use information.
- Household surveys establish baseline and endline data across large populations
- Focus group discussions capture lived experience and local context
- Key informant interviews connect insights across communities, institutions, and stakeholders
- Information Ecosystem Mapping reveals how information flows, who is trusted, and where barriers exist
DARAJA Addis Ababa Impact Slide Deck (2026)
DARAJA Addis Ababa Impact Slide Deck (2026)
DARAJA Sudan Year 1 Impact Slide Deck (2026)
DARAJA Sudan Year 1 Impact Slide Deck (2026)
DARAJA Kampala Impact Slide Deck (2026)
DARAJA Kampala Impact Slide Deck (2026)
DARAJA Tanzania Impact Slide Deck (2026)
DARAJA Tanzania Impact Slide Deck (2026)
DARAJA Nairobi & Dar es Salaam Impact Slide Deck (2020)
DARAJA Nairobi & Dar es Salaam Impact Slide Deck (2020)
Frequently Asked Questions
Answers to some commonly asked questions.
How do you measure impact?
We combine large-scale household surveys, community engagement, and continuous feedback mechanisms and tools, including Information Ecosystem Mapping, to measure changes in access, understanding, and action over time.
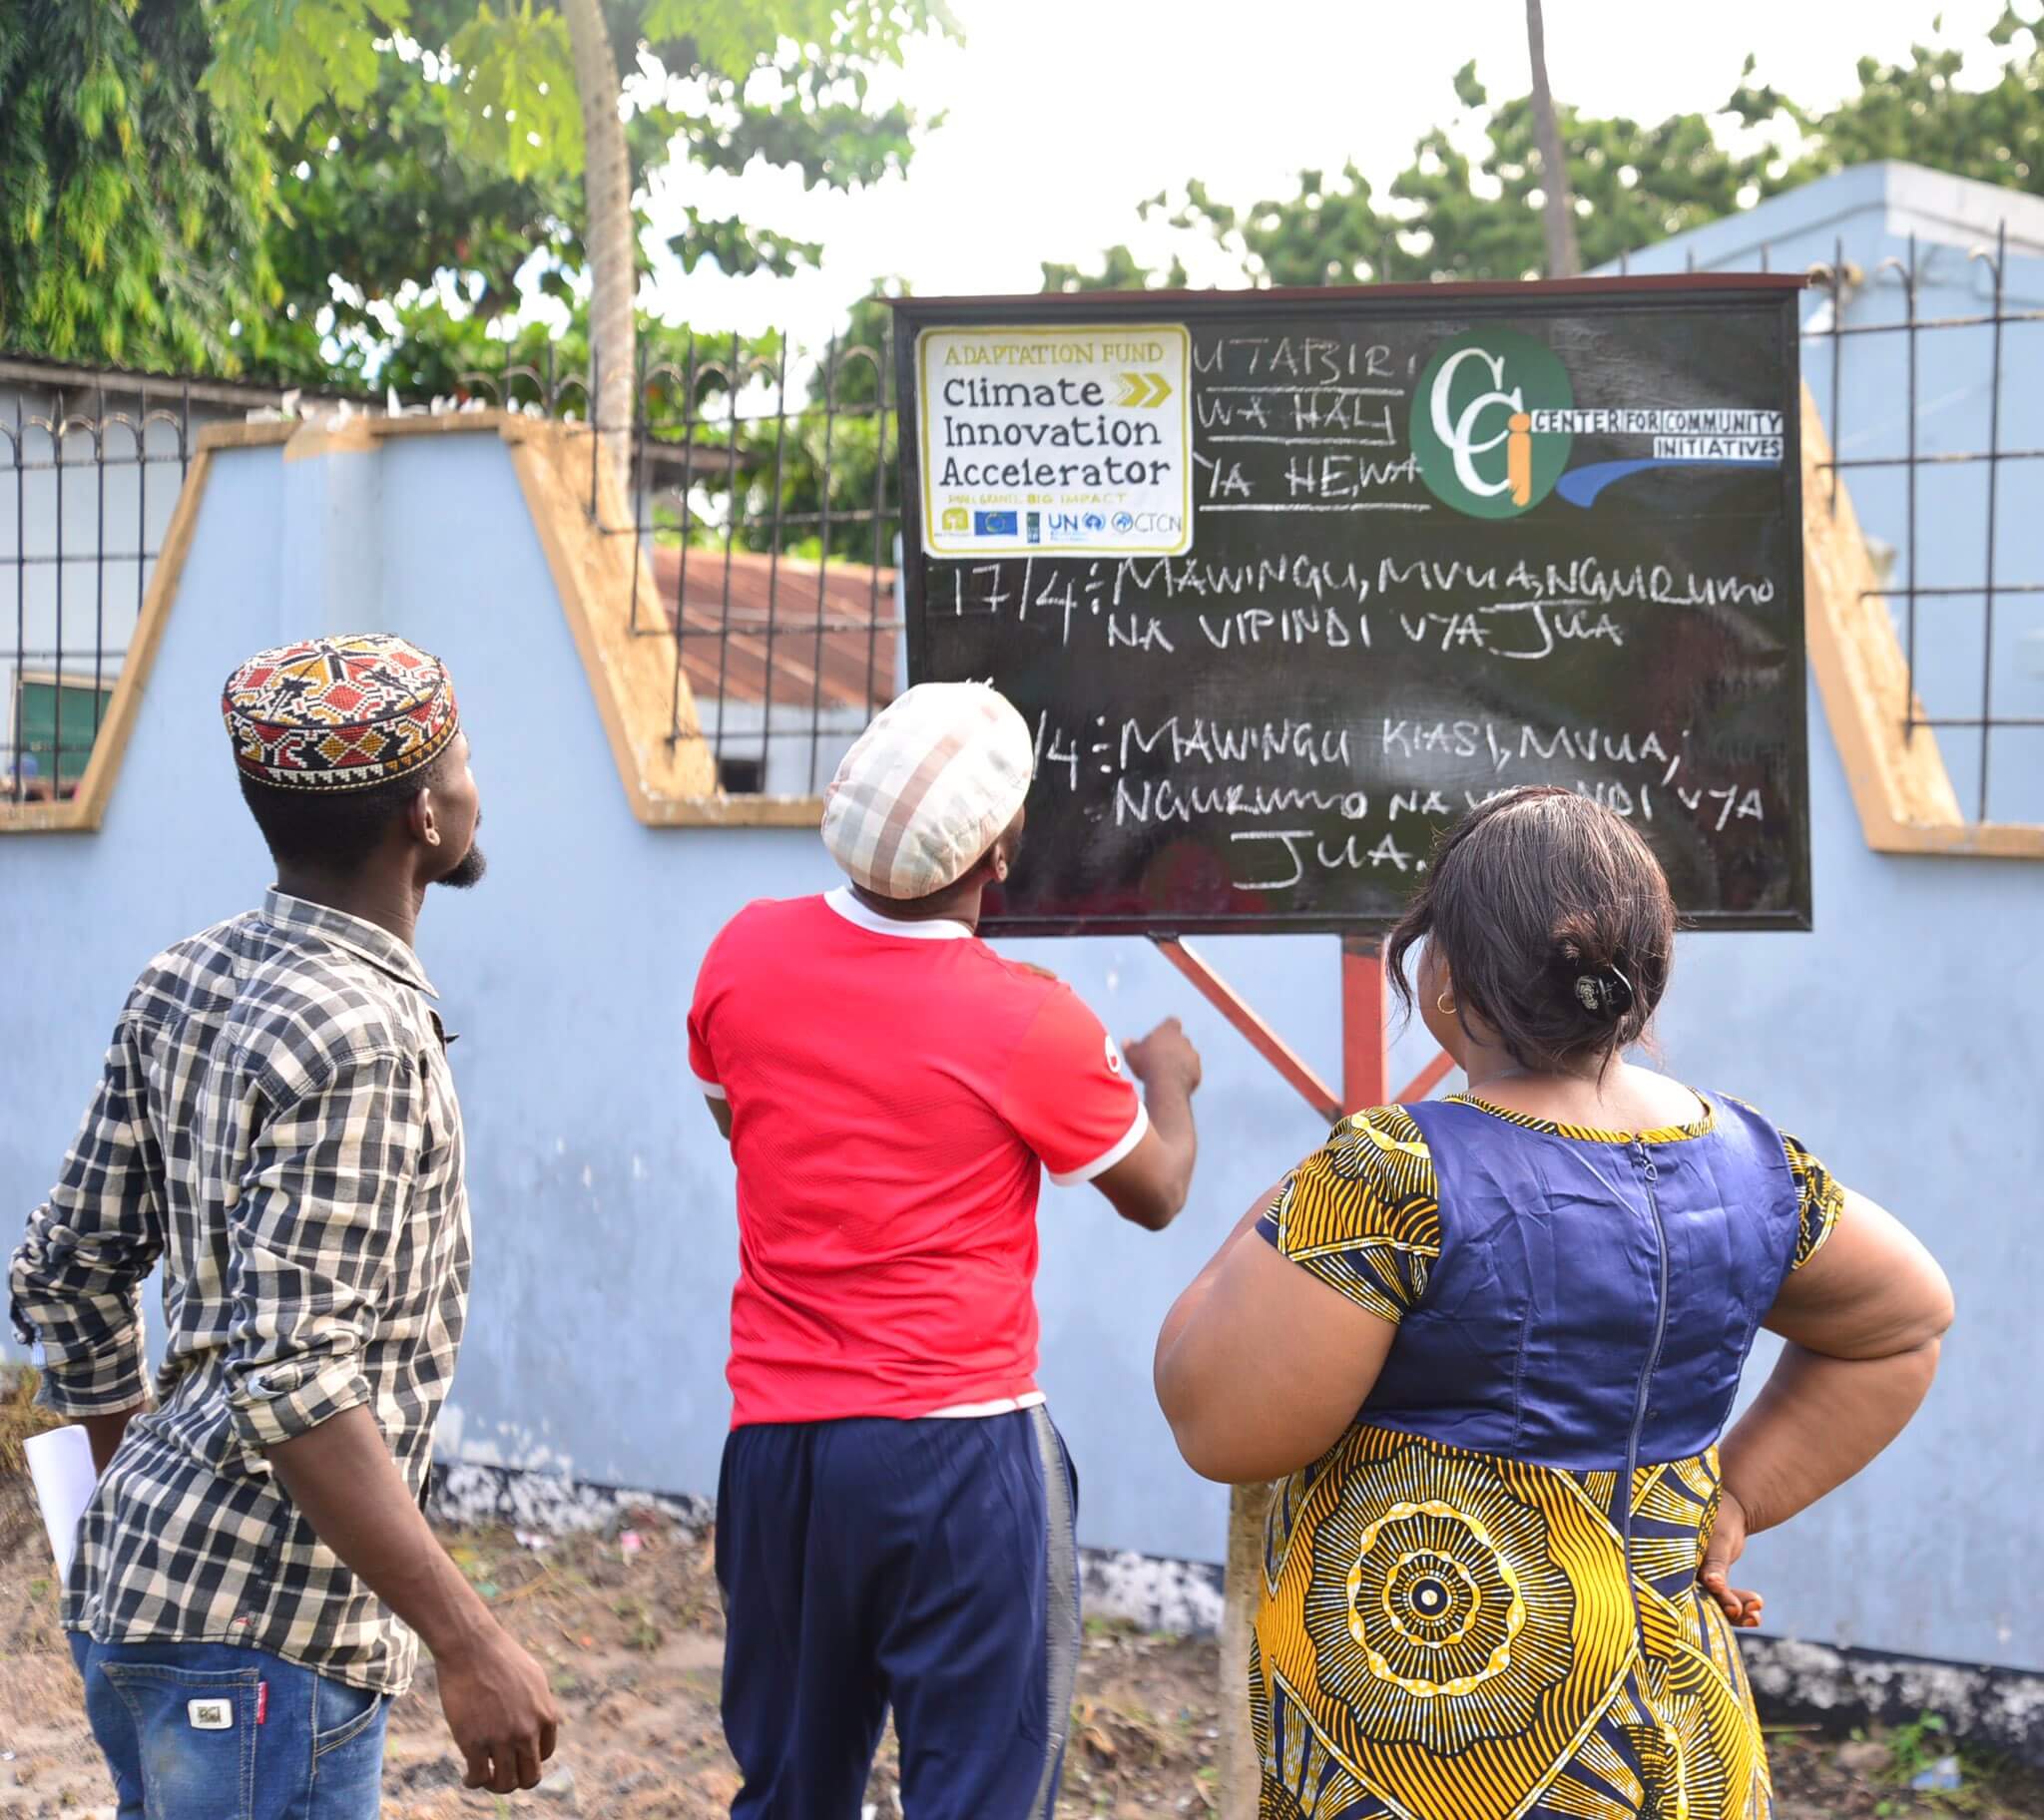
What is Information Ecosystem Mapping (IEM)?
DARAJA uses its proprietary Information Ecosystem Mapping to understand how climate information flows within communities and to continuously improve service delivery. IEM examines who produces and consumes information, what channels are trusted, and what barriers exist, ensuring climate services reach marginalised groups who often rely on informal or non-digital sources.
Our IEM process involves:
Mapping information flows: Identifying trusted intermediaries (e.g., community leaders, radio stations), preferred channels (e.g., WhatsApp, face-to-face communication), and communication bottlenecks
Analysing trust networks:
Understanding which sources communities trust and why
Identifying gaps: Recognising who is excluded and what channels are underutilised
Creating visual diagrams: Showing relationships between meteorological agencies, media outlets, community networks, and end-users
Validating findings: With communities, adapting strategies over time that respects cultural and linguistic diversity
Watch the video to find out more
What evidence shows your work is effective?
Baseline-to-endline data shows significant improvements in access to actionable information and increased preparedness behaviours, including home repairs and flood prevention actions.
How do you know communities are using the information?
We measure behaviour change, not just reach. Residents report using forecasts to take preventative action before extreme weather events, helping reduce damage and protect livelihoods.
How do you improve services over time?
Through Information Ecosystem Mapping and ongoing feedback loops, we continuously adapt how information is delivered to ensure it reaches the most vulnerable and is trusted by communities.
Explore the impact in more detail
Discover how our work is delivered across different contexts, and how partnerships can help scale proven approaches to climate resilience.
